What is Cost Function?
It is a function that measures the performance of a Machine Learning model for given data. Cost Function calculates the error between predicted values and expected values and presents it in the form of a single real number. Cost Function can be formed in many different ways depending on whether the problem is a regression problem or classification problem. The 3 main types of cost functions are:
- Regression Cost Function:
- Regression models deal with predicting a continuous value for example salary of an employee, price of a car, loan prediction, etc. A cost function used in the regression problem is called “Regression Cost Function”.
- Multi-Class Classification Cost Function
- This cost function is used in the classification problems where there are multiple classes and input data belongs to only one class.
- Binary Classification Cost Function:
- Binary cross-entropy is a special case of categorical cross-entropy when there is only one output that just assumes a binary value of 0 or 1 to denote negative and positive class respectively. For example-classification between cat & dog.
What is linear regression and how is it used in machine learning?
Linear regression is a statistical method based on supervised learning that is used for predictive analysis. Models based on this target a prediction value based on independent variables, it is commonly used to find a correlation between variables and forecasting.
Linear regression makes predictions for continuous/real or numeric variables such as sales, salary, age, product price, etc.
What is learning rate and what happens if it is too high or too low?
Learning rate is a hyper-parameter that controls how much we are adjusting the weights of our network each run with respect to the loss gradient. If your learning rate is too low, training will progress very slowly as you are making tiny updates to the weights in your network. However, if your learning rate is set too high, it can cause undesirable divergent behavior in your loss function.
What is feature scaling?
Feature Scaling is a technique to standardize the independent features present in the data in a fixed range. It is performed during the data pre-processing to handle varying magnitudes, values, or units. If feature scaling is not done, then a machine learning algorithm tends to weigh greater and higher values and consider smaller values as the lower ones, regardless of the unit of the values.
What are the features of polynomial regression?
Polynomial regression is a form of regression analysis in which the relationship between the independent variable x and the dependent variable y is modeled as an nth-degree polynomial in x. It provides the best approximation for non-linear relations between the x/y.
Polynomial regression extends the linear model by adding extra predictors obtained by raising each original predictor to a power. For example, a cubic regression uses three variables, X, X2, and X3, as predictors.
What conditions/features affect the hypothesis for any given data set?
- Sample size
- The method of sampling
- The shape of the distribution
- The level of measurement of the variable.
What is logistic regression?
It is an example of supervised learning; it is used to calculate the probability of a binary(yes/no) event occurring based on prior observations of a dateset. The idea of Logistic Regression is to find a relationship between features and the probability of a particular outcome.
What are the assumptions made in logistic regression?
Assumptions made in logistical regression models:
- It assumes that there is no minimal or no multi collinearity among the independent variables.
- It assumes that there are NO highly influential outlier data points, as this would distort the outcome & accuracy of the model.
- There should be a linear relationship between the legit (log-odds) of the outcome and each predictor variable. The logit function is given as logit(p) = log(p/(1-p)), where p is the probability of the outcome
- The model usually requires a large sample size to predict properly.
What is the sigmoid function, and why is it so important?
The sigmoid function is an activation function in machine learning that decides which values to pass as output and which not to pass. These outliers are extreme values within a data set that are outside the range of what is expected and is unlike other data.
What is regularization?
Regularization is a process in which the adjusted loss function is minimized to prevent over fitting or under-fitting. It prevents over-fitting by discouraging the model from learning a more complex or flexible model.

What is deep learning?
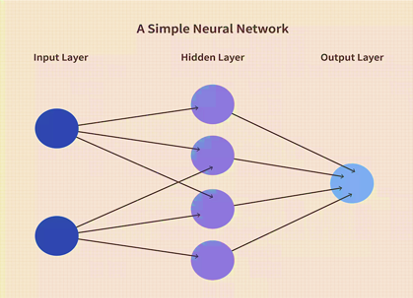
Deep Learning is a sub-genre of machine learning concerned with algorithms inspired by the structure and function of the brain called artificial neural networks. The neural network consists of 3 or more layers that try to simulate the behavior of a human brain by “learning” from large data sets given to it.
What are neural networks?

A neural network is a series of algorithms run through different layers that aim to recognize underlying relationships in a data set through a process that mimics how the human brain operates. It usually consists of 3 layers at minimum. An input layer, a hidden layer(s), and an output layer.
What Are the Applications of a Recurrent Neural Network (RNN)?
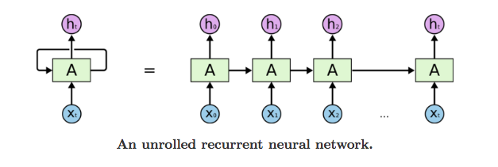
RNNs are a type of artificial neural network that recognizes sequential data or time series data characteristics and uses patterns to better predict a likely scenario. RNNs can be used for sentiment analysis, text mining, and image captioning. Recurrent Neural Networks can also address time series problems, such as predicting the prices of stocks in a month or quarter.

What is the difference between regression and classification?
The main difference between regression and classification is that the output variable in the regression is numerical (or continuous) while that for classification is categorical (or discrete). Logistic regression is a supervised classification algorithm.
Can the cost function used in linear regression work in logistic regression?
The cost function J(θ) used in linear regression cannot work with logistic regression. In linear regression, we use the squared error mechanism, and unfortunately, for logistic regression, such a cost function produces a nonconvex space that is not ideal for optimization. There are many local optima on which our optimization algorithm might prematurely converge before finding the true minimum if we use the same cost function.
What is overfitting, and how can you avoid it?
Overfitting occurs when the model learns the training set too well. It takes up random fluctuations in the training data as concepts. These impact the model’s generalization ability and do not apply to new data. The following methods are done to avoid overfitting:
- Regularization: This involves a cost term for the features involved with the objective function.
- Make a simple model: The variance can be reduced with fewer variables and parameters.
- Cross-validation methods, like k-folds, can also be used.
- If some model parameters are likely to cause overfitting, techniques for regularization like LASSO can be used that penalize these parameters.
What is the difference between Classification and Clustering?
Classifying data into pre-defined categories and Clustering is the grouping of data into a set of categories.
Can Classifiers and Clustering work together?
Yes, and these are how they can:
- Classification assigns the category to 1 new item based on already labeled items, while Clustering takes a bunch of unlabelled items and divides them into categories.
- Examples of them being used together:
- you have a set of articles -> you divide these articles into clusters based on the tags -> The Articles are grouped based on the tags. Now you have an article -> Article is sent to Classifier, and Classifier will assign one of the tags from the tags that are discovered during Clustering above – > Tag is identified.
- In Classification, there are 2 phases – The training phase and then the test phase, while in Clustering, there is only 1 phase – the dividing of training data in clusters.
What is feature selection?
A = It is a method to simplify the model and improves the speed, it is also done to avoid too many features. P-value in the regression coefficient table can be used to drop insignificant variables.
What is the difference between overfitting and underfitting?
A = Under-fitting happens when the model has not captured the underlying logic of the data. Overfitting happens when the model has focused too much on the training data set that it cannot understand the test dataset.
How to identify if the model is overfitting or underfitting?
Underfit model performs badly (low accuracy) on training and badly (low accuracy) on tests. Overfit model performs good (high accuracy) on training and bad (low accuracy) on tests. A good model performs well (high accuracy) in training and good (high accuracy) on tests.
What is cluster analysis?
Cluster analysis is a multivariate statistical technique that groups observations based on features. Moreover, observations in a dataset can be divided into different groups, which is sometimes very useful.
What is the goal of clustering analysis?
The goal of clustering analysis is to maximize the similarity of observations within a cluster and maximize the dissimilarity between clusters.
What is the difference between supervised learning and unsupervised learning?
In supervised learning, we are dealing with labeled data. We know the correct values before training our model. Examples are regression and classification. We do not know the correct values in unsupervised learning before training our model. Examples are clustering.


