Linear regression is a statistical method based on supervised learning used for predictive analysis. Models based on this target a prediction value based on independent variables, commonly used to find a correlation between variables and forecasting.Linear regression predicts continuous/real or numeric variables such as sales, salary, age, product price, etc.

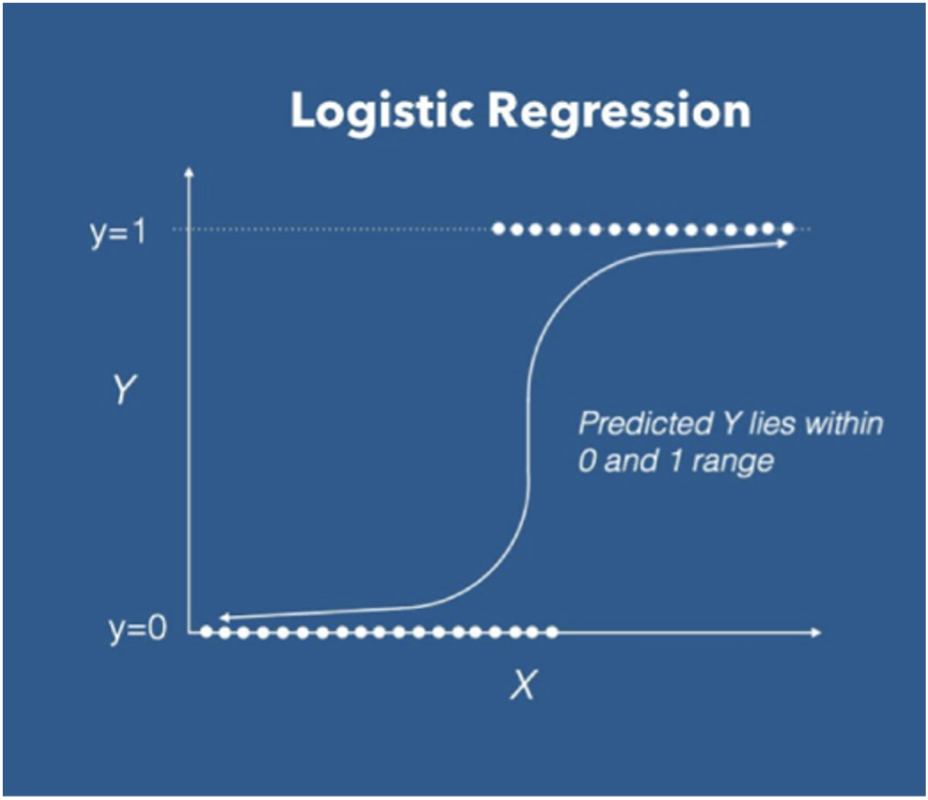
Logistic regression is an example of supervised learning; it is used to calculate the probability of a binary(yes/no) event occurring based on prior observations of a dataset. The idea of Logistic Regression is to find a relationship between features and the probability of a particular outcome.
Differences between Liner Regression & Logistic Regression:
| Liner Regression | Logistic Regression | |
| Variable Data Type | Continuous | Categorical |
| Problem Type | Regression | Classification |
| Curve Type | Straight line | Curve line |
| Output | Predicted integer value | Binary value between 0 & 1 |
| Purpose | It estimates “y” in case of a change to “x” | It is used to calculate the probability of an event occurring. |
| Use Cases | Business domain, predicting stocks | Classification, image processing |
| How to Measure Accuracy | Least squares estimation | Maximum likelihood estimation |
There are a few key differences between linear and logistic regression:
- The response variable: Linear regression is used to predict a continuous response variable, while logistic regression is used to predict a binary response variable.
- The prediction equation: Linear regression uses a linear equation to make predictions, while logistic regression uses a non-linear logit function.
- The error function: Linear regression uses the mean squared error (MSE) as the error function, while logistic regression uses the cross-entropy loss function.
- The assumptions: Linear regression assumes a linear relationship between the independent and dependent variables and that the residuals are normally distributed. Logistic regression does not make these assumptions.
- The interpretation of the results: The coefficients in a linear regression model can be interpreted as the change in the response variable for a one unit change in the predictor variable, holding all other variables constant. In logistic regression, the coefficients can be interpreted as the log odds of the response variable occurring given a one unit increase in the predictor variable, holding all other variables constant.
- Evaluation metrics: To evaluate the performance of a linear regression model, common metrics include the R-squared value, which indicates the percentage of variance in the response variable that is explained by the model, and the root mean squared error (RMSE), which measures the average difference between the predicted and actual values. For logistic regression, common evaluation metrics include the accuracy, which measures the proportion of correct predictions made by the model, and the confusion matrix, which shows the number of true positive, true negative, false positive, and false negative predictions made by the model.
- Outliers: Linear regression is sensitive to outliers, or extreme values in the data that can significantly impact the model’s predictions. Logistic regression is less sensitive to outliers because the logit function is more resistant to extreme values.
- Overfitting: Both linear and logistic regression can be prone to overfitting, or the tendency of a model to perform well on the training data but poorly on unseen data. To prevent overfitting, it is important to use techniques such as regularization and cross-validation.
- Multicollinearity: Multicollinearity occurs when two or more independent variables in a model are highly correlated. This can make it difficult to interpret the coefficients of the variables in a linear regression model. Logistic regression is less affected by multicollinearity because it estimates the log odds of the response variable rather than the actual probability.


